Business intelligence / BigQuery / Public data
FEC Campaign Finance Analysis
I analyzed individual and committee contributions across the 2018 and 2020 election cycles. The central challenge was deciding what to count when source tables repeat records and fundraising platforms report the same activity differently.
What the reporting choice changes
The WinRed-exclusion scenario totals about USD 15.25 billion in qualifying itemized records. Individuals account for roughly 83%. October 2020 is the peak month under both definitions. These are contribution records, not a verified count of unique donations.
USD 15.25B
Qualifying amount in the WinRed-exclusion scenario
2,603
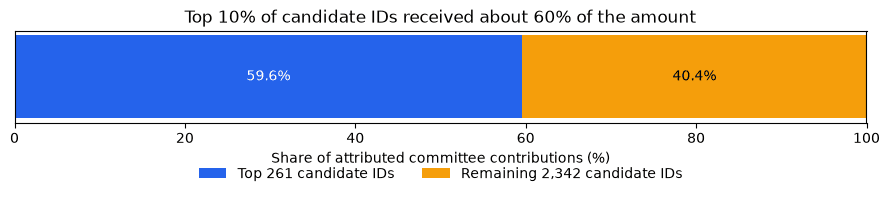
Candidate IDs receiving committee contributions in that scenario
59.6%
Share of attributed committee money received by the top 10% of candidate IDs
Checks before conclusions
The 2020 individual table contains 195.5 million rows but only 88.8 million distinct record IDs. I compared the repeated records before selecting stable analysis fields. I also checked source coverage, candidate attribution, transaction types, memo flags and date ranges.
ActBlue and WinRed use different reporting patterns. The report shows the original totals beside a WinRed-exclusion scenario and documents what that comparison can and cannot establish. Excluding reporting can remove unmatched records as well as reduce overlap.
A model that can be inspected
The SQL builds staging views, a saved deduplicated individual table, committee and candidate dimensions, a fact view and monthly aggregates. Reconciliation checks connect the final totals back to the source-level results.
The project includes all 29 queries, the notebook, charts and saved quality-check results. The business-payee section is an analysis plan with source checks and delivery estimates; it does not claim a verified top-10 ranking.
FEC · BigQuery SQL
1-- 21_monthly_chart_data2-- I use the saved monthly summary to compare the two sources3-- over time without scanning the original contribution tables again.45WITH monthly AS (6 SELECT7 contribution_month,8 SUM(9 IF(source_type = 'individual', gross_amount, 0)10 ) AS individual_amount,11 SUM(12 IF(source_type = 'committee', gross_amount, 0)13 ) AS committee_amount,14 SUM(gross_amount) AS total_amount15 FROM16 `fec-contributions-analysis.fec_analysis.agg_contributions_monthly`17 GROUP BY contribution_month18)1920SELECT21 contribution_month,22 individual_amount,23 committee_amount,24 total_amount,25 100 * SAFE_DIVIDE(26 total_amount - LAG(total_amount) OVER (27 ORDER BY contribution_month28 ),29 LAG(total_amount) OVER (30 ORDER BY contribution_month31 )32 ) AS month_over_month_growth_pct33FROM monthly34ORDER BY contribution_month;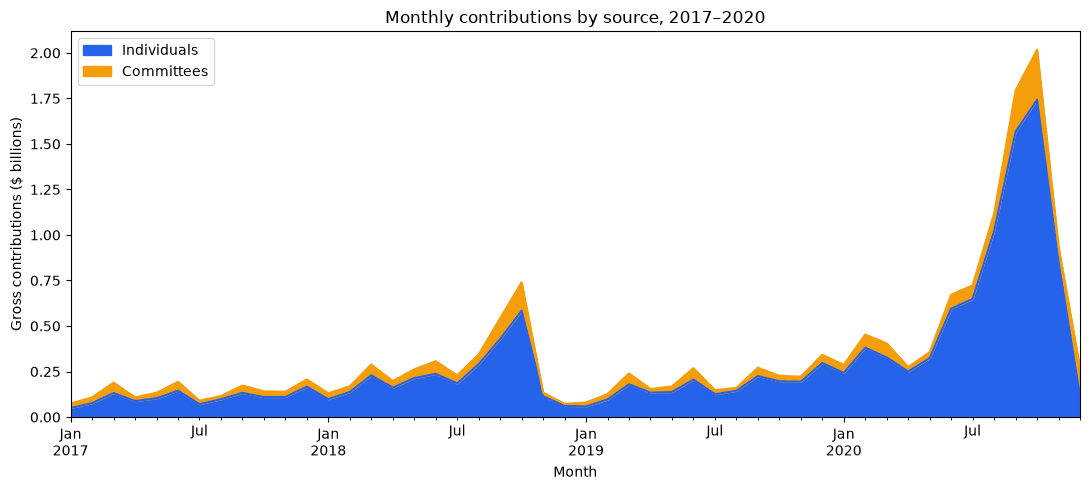
Source: public Federal Election Commission tables in BigQuery. The analysis covers January 2017 through December 2020. Itemized records do not include every small donation, and reported candidate IDs are not a verified count of distinct people. The report contains the complete definitions and limitations.