Business intelligence · Public data
FEC Campaign Finance Analysis
BigQuery analysis of the 2018 and 2020 election cycles, with 29 SQL queries, data-quality checks, reporting models and a stakeholder report.
Business question
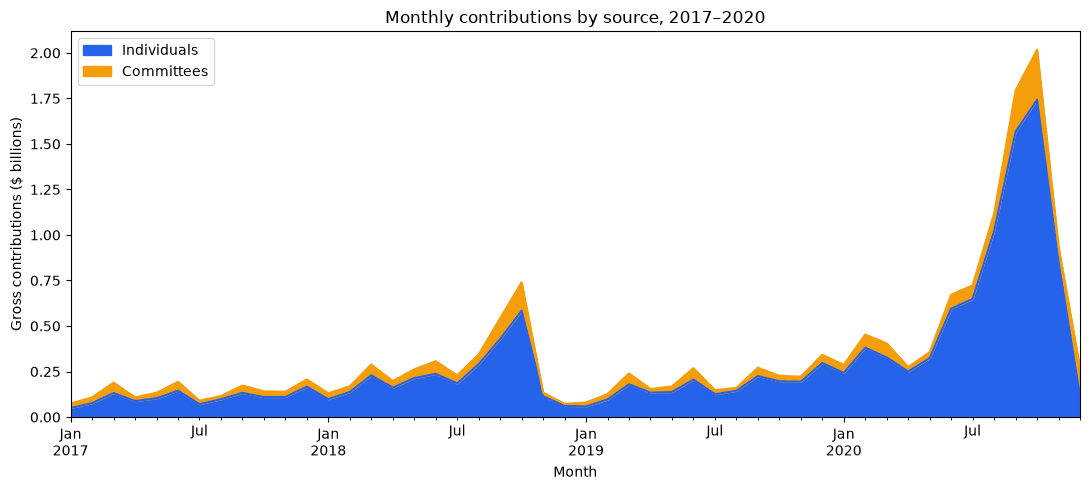
How much came from individuals and committees, who received committee contributions, and how does intermediary reporting affect the answers?
Investigates repeated IDs and fundraising-platform overlap, reconciles reporting totals, and makes the effect of alternative contribution definitions visible.
BigQuerySQLData ModelingData QualityBusiness Intelligence
View working project FEC Campaign Finance Analysis · source preview
1-- 21_monthly_chart_data2-- I use the saved monthly summary to compare the two sources3-- over time without scanning the original contribution tables again.45WITH monthly AS (6 SELECT7 contribution_month,8 SUM(9 IF(source_type = 'individual', gross_amount, 0)10 ) AS individual_amount,11 SUM(12 IF(source_type = 'committee', gross_amount, 0)13 ) AS committee_amount,14 SUM(gross_amount) AS total_amount15 FROM16 `fec-contributions-analysis.fec_analysis.agg_contributions_monthly`17 GROUP BY contribution_month18)1920SELECT21 contribution_month,22 individual_amount,23 committee_amount,24 total_amount,25 100 * SAFE_DIVIDE(26 total_amount - LAG(total_amount) OVER (27 ORDER BY contribution_month28 ),29 LAG(total_amount) OVER (30 ORDER BY contribution_month31 )32 ) AS month_over_month_growth_pct33FROM monthly34ORDER BY contribution_month;